
Study: I analyzed 62.089 analyst estimates. The results should worry retail investors.
62000 Data points. 1103 Companies. Unexpected Results.

Every quarter, financial media goes into a frenzy. Analyst estimates dominate the headlines. Beat the estimate and the stock surges. Miss it and the stock tanks. Retail investors are told to watch these numbers closely.
But should they?
That question got me curious. How accurate are analyst estimates in the first place? And does it differ between European and American companies?
To answer these questions, I decided to do a study on it myself. And like my previous study on European 100 baggers, it turned out to be more work than expected.

The study is built up as follows: first, the steps of the process are explained, followed by the discussion of the results. After that, there is a discussion about the shortcomings of the study. Or jump directly to the results.
Why this matters for retail investors
Many retail investors follow analyst consensus estimates to time their buys and sells around earnings season. The logic seems straightforward: if a company beats estimates, buy. If it misses, sell. Or better yet, buy before the beat.
This study wants to address how useful that guidance actually is. Because if analysts are frequently wide of the mark, then following their estimates to make investment decisions is terrible advice.
The core questions this study tries to answer are:
What percentage of companies fall within a +/- 5% range of the analyst consensus?
Does the accuracy differ between European and American companies?
How far off are analysts when they are wrong?
And are analysts systematically optimistic or pessimistic in each market?
The answers may surprise you. Let’s dive in.
Process
Original studies on analyst accuracy do exist. However, they are mainly focused on the US stock market or worldwide.
Since I am interested in the European stock market, I took it upon myself to collect, clean and analyze the data.
The typically used dataset in research papers is called I/B/E/S Estimates owned by the London Stock Exchange Group. It contains all the estimates from analysts all over the world.
Acquiring the dataset is slightly outside my budget. It costs a staggering $10,000 to get access. Well, I had to resort to finding the next best thing: financialmodelingprep.com (FMP). For $139/month, I got access to much of the last 2 decades of analyst estimates.
Who are these analysts you’re talking about?
Major institutions employ business analysts who are assigned to follow a specific industry. They read trade magazines, go to industry conferences and talk with management of companies in the industry.
Based on that information, the analyst writes reports and comes up with estimates on earnings and revenue for the upcoming quarter or year.
Mostly banks and funds share estimates publicly. Among them are Bank of America, Goldman Sachs, Morgan Stanley, JPMorgan, Barclays, UBS, Wells Fargo, and others.
The Scope
The scope of the study was defined as follows:
S&P 500 and STOXX 600 constitutes. These companies are the largest and most likely to be covered by major institutions.
Minimum market cap of 1 billion in local currency
All data recorded in local currency
Financial services and real estate sectors are excluded. Their earnings structure differs too much from other industries
Semi-annual reporting included, which is common among European companies
The database
After pulling all the data, the raw dataset contained 62,089 analyst estimates from 1103 companies. 600 European companies and 503 American companies.
After applying the scope of the study, the last step towards a usable dataset is cleaning. Skimming through the data uncovered concerning outliers.
When the consensus (average earnings estimate of all analysts) is close to zero, a big beat or miss creates a huge surprise (percentage difference between estimate and actual earnings).
Take the aviation company Boeing, for example. In Q4 of 2025, analyst consensus was $-0.43 EPS for the quarter. The reported earnings per share were $10.59. A whopping 2500% difference.
To adjust for such unusual cases, I did what other researchers also did, winsorizing. This method caps extremes. I choose 500%. It still shows in the dataset that analysts were off, but the reduction prevents major skewing of the results.
Other extreme cases had estimates close to zero, like 1 or 2 cents. When actual earnings are closer to 10 or 20 cents or more, analysts are off by a factor of 10.
To avoid this type of extreme results, I filtered out all estimates between -0.05 and 0.05 (in local currencies). Again followed a standard among researchers.
Obviously, such extremes have to do with multiple factors I address later in the shortcomings section.
After cleaning the raw data and applying the scope, 299 companies and 13496 estimate records got dropped. The table below displays the leftover distribution.
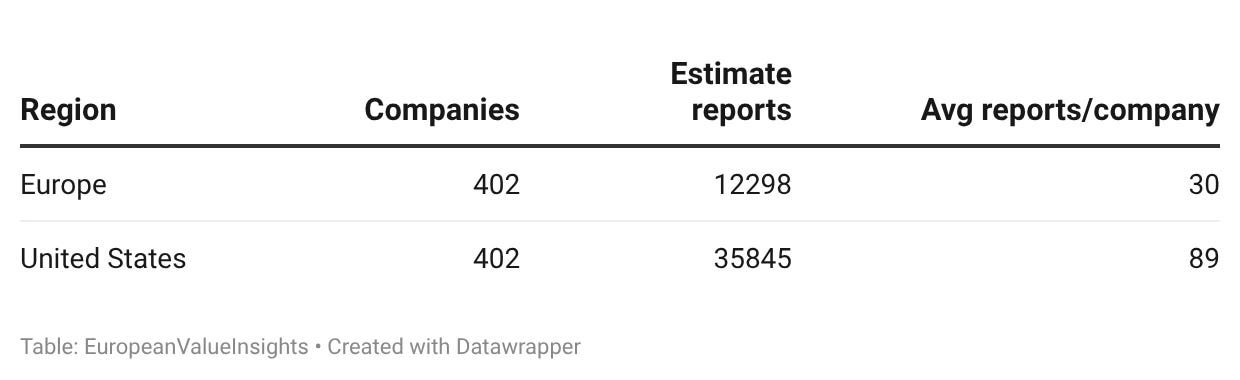
Both indexes provide an equal number of companies. The difference is the number of estimate reports recorded. The United States represents on average 3x more reports due to 2 factors:
American companies are obliged to report quarterly, while most European companies prefer semi-annual reporting.
Data vendors have more accurate data on US companies. There is less interest in European companies, thus less effort to provide complete datasets.
The analyst estimate report distribution per quarter proves point #1.
Results
Before we dive into the results, it is important to note that estimates are Non-GAAP (General Accepted Accounting Standards) while reported earnings are GAAP. Analysts use the Non-GAAP, because it reflects a clearer view of the core operations.
It is comparing apples and oranges. Yet, the surprise between actual and estimated earnings is widely looked at across the financial industry.
Analyst consensus with in 5% of actual earnings
Analysts spend their days following a particular industry and the public companies within it. They talk with management of these companies, read trade journals and go to industry conferences.
With all that information, do they predict accurately the earnings for the next quarter?
As it turns out, just 16.4% of the estimates for American companies fell within a margin of 5%. 5 out of 6 estimate reports were off by more than 5%.
Analysts covering European companies were close enough in only 14.6% of the cases.
Over 80% falls outside the window of 5%. This raises the next question:
How far off are the analysts when they miss?
Typically, analysts covering American companies are off by an absolute median 22.6%. For European companies it is over 27%.
The median is used here due to the earlier mention of winsorizing. The extreme outliers would skew the results when using the average. It would be over 56% and 70% respectively. While the median is the middle value when mapping all the results and putting them in a row.
These results suggest that analysts are off frequently and by a fair margin. This raises a new question:
Do analysts tend to overestimate or underestimate earnings?
Surprisingly, analysts covering the United States are neutral. 49.3% of the consensus estimates are optimistic, while 47.7% is underestimating the earnings. 3% of the consensus is equal to the reported earnings.
The picture looks different for European companies. Analysts are optimistic 60.4% of the time and pessimistic only 38.4% of the time. 2.2% of the time, estimates earnings are equal to the actual earnings.
Does the number of analysts covering a stock affect accuracy?
A reasonable assumption is that more analyst’s coverage leads to better estimates. It averages out the outliers.
For American companies, accuracy stays relatively stable across analyst buckets. Analysts are off between 20% and 25%.
Coverage accuracy for European companies tells a different story. A trend emerges that the more analysts cover a company, the further the consensus estimate of the actual reported EPS is.
The dataset doesn’t cover which analyst made which estimate. It would have been interesting to take a closer look at why European companies have a higher error rate.
Are European companies listed as ADRs in the US covered more accurately?
This question stems from the previous question. Since American companies have better estimate accuracies, would this trend be visible with European companies listed through ADRs on the New York Stock Exchange or the NASDAQ?
ADRs are American Depositary Receipts. It allows US investors to purchase foreign companies in their own currency.
In the chart above, companies listed through ADRs on the NYSE or NASDAQ are on average better covered by analysts compared to other European companies.
However, the estimates are worse. The analyst consensus of companies listed through ADRs are further off from the actual reported earnings.
A similar trend exists with estimates within 5% of the reported earnings. Again, the other European companies’ estimates are more often outside the 5% of the actual earnings.
It is kinda surprising, as the biggest European companies are listed in the US. They have more coverage yet perform worse.
Are European companies more complex? Or are they less transparent towards analysts compared to their American counterparts? Unfortunately, this dataset won’t answer such questions. Maybe a new study? :)
Shortcomings
The most significant limitation of this study is survivorship bias. The dataset is a snapshot of current listed companies in the indexes S&P 500 and STOXX 600. Companies that were delisted, went bankrupt or were acquired are absent. Their estimates might be totally different.
The second limitation is the data vendor FMP. They don’t own the most used data on this topic. They collect it independently through released reports. While most samples I checked with other online sources were the same, there were also a few minor differences.
It might happen that reported earnings or estimates get adjusted later, typing errors or something else. For the best results, the I/B/E/S Estimates database owned by the London Stock Exchange Group is the best option.
Third, capping extreme outliers and excluding estimates close to zero reduces huge differences in outcome. While most samples looked like data errors, some might have been real world estimates.
Removing and changing data is always a trade-off between readability of outcomes and the potential risk of removal of real data, however unlikely it is.
Why are analyst estimates so often off?
Analysts are not independent. They work for banks and brokerages that have business relationships with the companies they cover. Issuing a negative estimate might damage the relationship. Even when it should be independent.
Analysts, also, can potentially move the market (short-term) for the bank/fund they work for to unload or load up on shares.
There is also the Non-GAAP vs GAAP problem discussed earlier. Analysts model adjusted earnings which supposedly reflect a more truthful representation of what is going on in the company. However, the company has to report earnings following GAAP figures.
Investment write-offs, lawsuit settlements, etc. can move outcomes significantly.
Lastly, there might be a psychological effect at work, price anchoring. When a well-known financial institution publishes an estimate, others cluster around it. The consensus becomes self-reinforcing rather than independently derived.
Conclusion
This study set out to answer one question: should retail investors follow analyst estimates?
Across 62,089 records spanning the S&P 500 and STOXX 600, analysts land within 5% of actual earnings fewer than 1 in 6 times. The median miss exceeds 22% for American companies and 27% for European ones. European coverage carries an additional optimism bias, with analysts overestimating earnings 60% of the time.
The answer to the opening question is a resounding no.
Disclaimer
The information provided in this newsletter is for informational purposes only and does not constitute financial, investment, or professional advice. All opinions expressed herein are solely those of the author and are based on publicly available information as of the date of publication. Investments in stocks and other securities involve significant risk, including the potential loss of principal. Past performance is not indicative of future results. Readers are encouraged to do their own research and consult with a qualified financial advisor before making any investment decisions. The author and publisher of this newsletter assume no responsibility for any errors, omissions, or outcomes related to the use of this information.
By reading this newsletter, you acknowledge that the author is not liable for any decisions made based on the content provided.
Impressive work! I was a bit skeptical to analyst estimates before, now I am even more skeptical. It's also interesting to see the difference between Europe and the USA.
so this compares adjusted EPS estimates to GAAP / IFRS actuals ? I wouldnt expect very high accuracy either when tax matters and non-cash write-offs can cause the divergence.
EBIT would make more sense, only SBC tends to skew that from the accounting standard actuals.